Contact Center Analytics: Tableau & CSAT Reporting
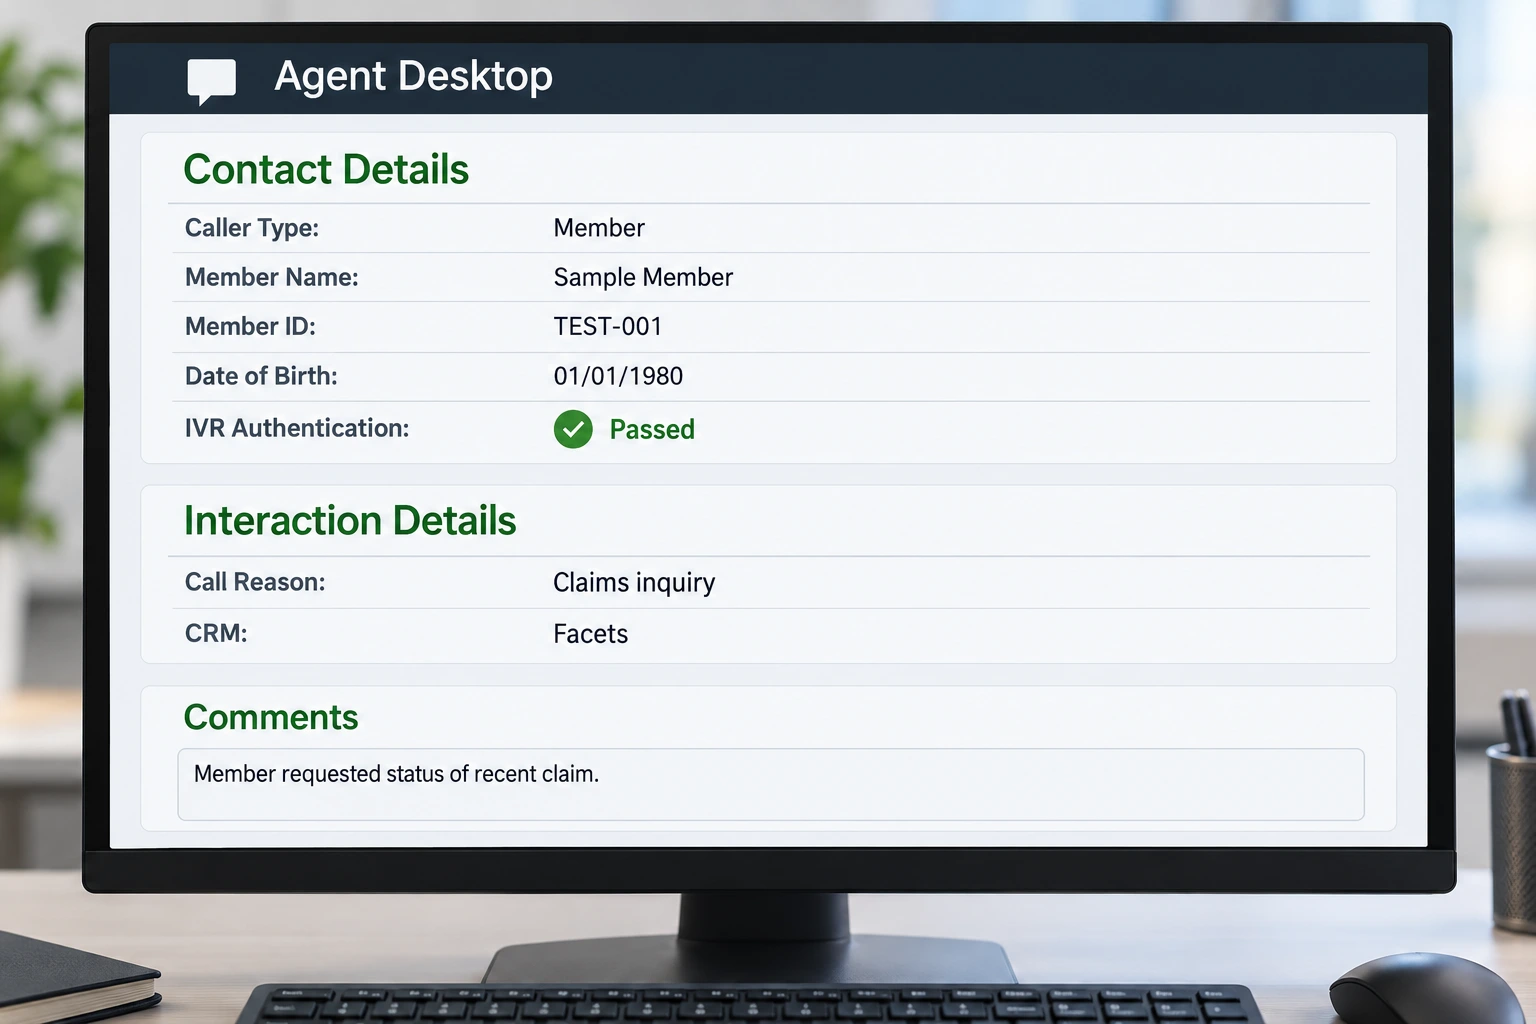
I built a Tableau dashboard used by my leadership team to track daily call center activity, agent task status recorded in Facets, call trends and first-contact resolution (FCR) rates.
I also developed monthly reporting to compare increases and decreases in the highest-volume call reasons, with separate Member and Provider views, top-five call drivers, and changes in call counts and percentages.
I organized monthly Member and Provider call survey data in Excel and used AI assistance to create an FY26 CSAT dashboard from that data. The dashboard provided a structured view of survey results for reviewing the caller experience over the fiscal year.
Leadership value: I connected daily operational visibility with monthly performance review, helping leaders identify emerging call drivers and focus further investigation and improvement priorities.